
Understand AI Analytics metrics
AI Analytics shows how shoppers interact with the AI search features of Motive Commerce Search. Use it to see how these features help shoppers discover products, and how often they lead to product clicks and add-to-carts, that is, products that shoppers add to the basket.
To open AI Analytics, click Analytics > AI Analytics in the left-side menu in the Playboard. You can also click Explore AI Analytics on the Analytics page.
AI Analytics has a section for each AI feature:
Each section starts with a summary of the data for the selected time frame, followed by the main metrics.
To filter data by language or time frame, see Manage Analytics.
AI suggestions
The AI suggestions section shows how shoppers use AI Next Queries and AI Related Tags to keep exploring. It also shows how often these suggestions lead to product clicks and add-to-carts.
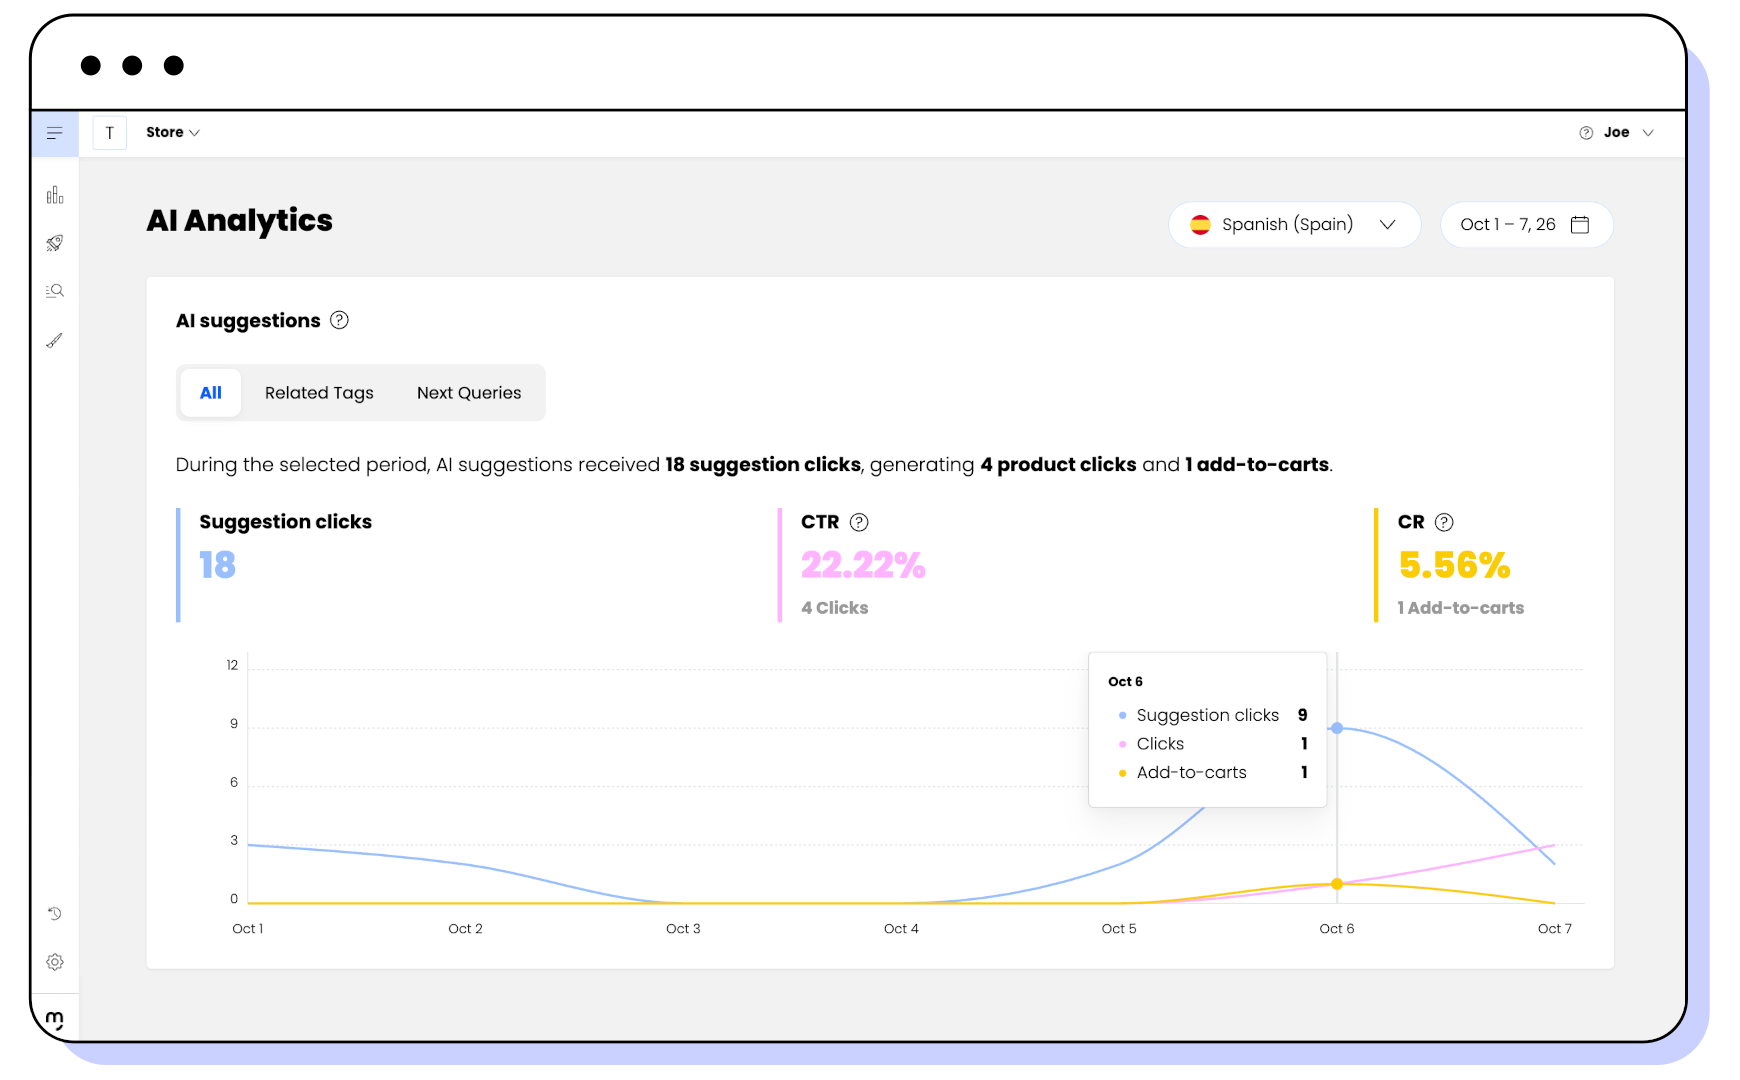
The AI suggestions section displays the following:
- Suggestion clicks: Number of times shoppers click an AI suggestion.
- CTR: Click-through rate. Percentage of clicks on AI suggestions that lead to a click on a product result.
The number of suggestion clicks that lead to a product click appears below. - CR: Conversion rate. Percentage of clicks on AI suggestions that lead to a product being added to the basket.
The number of suggestion clicks that lead to an add-to-cart appears below.
For example, in the image, shoppers click AI suggestions 16 times. One of those suggestion clicks leads to a product click, so the CTR is 6.25%. One suggestion click leads to a product being added to the basket, so the CR is also 6.25%. If shoppers click several products after the same suggestion click, it counts as one.
CTR and CR in AI suggestions
In AI suggestions, CTR and CR are calculated on suggestion clicks. In Analytics, they are calculated on searches. Compare these rates only with other AI suggestions data.
The chart shows how these metrics evolve over the selected time frame. By default, the section shows data for both features. To see data for one feature only, select Related Tags or Next Queries at the top of the section.
AI Mode
The AI Mode section shows how shoppers use AI Mode to search in a conversational way, through prompts. A prompt is each message that a shopper sends in AI Mode, for example, a question or a description of the product they need.
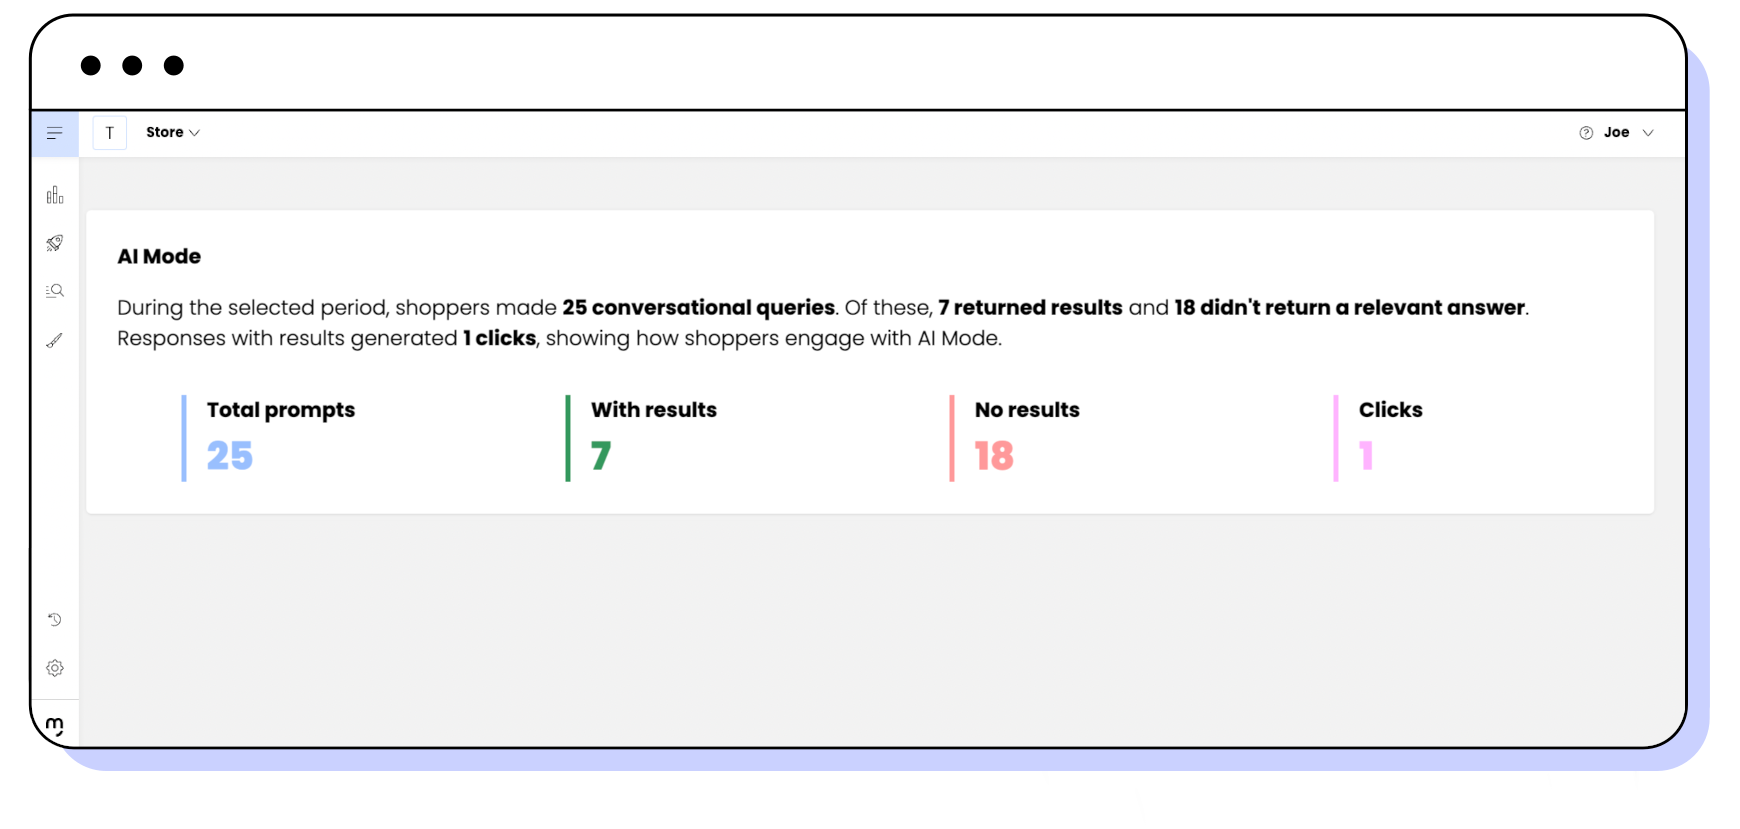
The AI Mode section displays the following:
- Total prompts: Number of prompts that shoppers send in AI Mode.
- With results: Number of prompts that return results.
- No results: Number of prompts that don't return a relevant answer.
- Clicks: Number of product clicks from AI Mode responses with results.
AI Carousels
The AI Carousels section shows how shoppers interact with AI Carousels. These product carousels appear when a search returns no results.
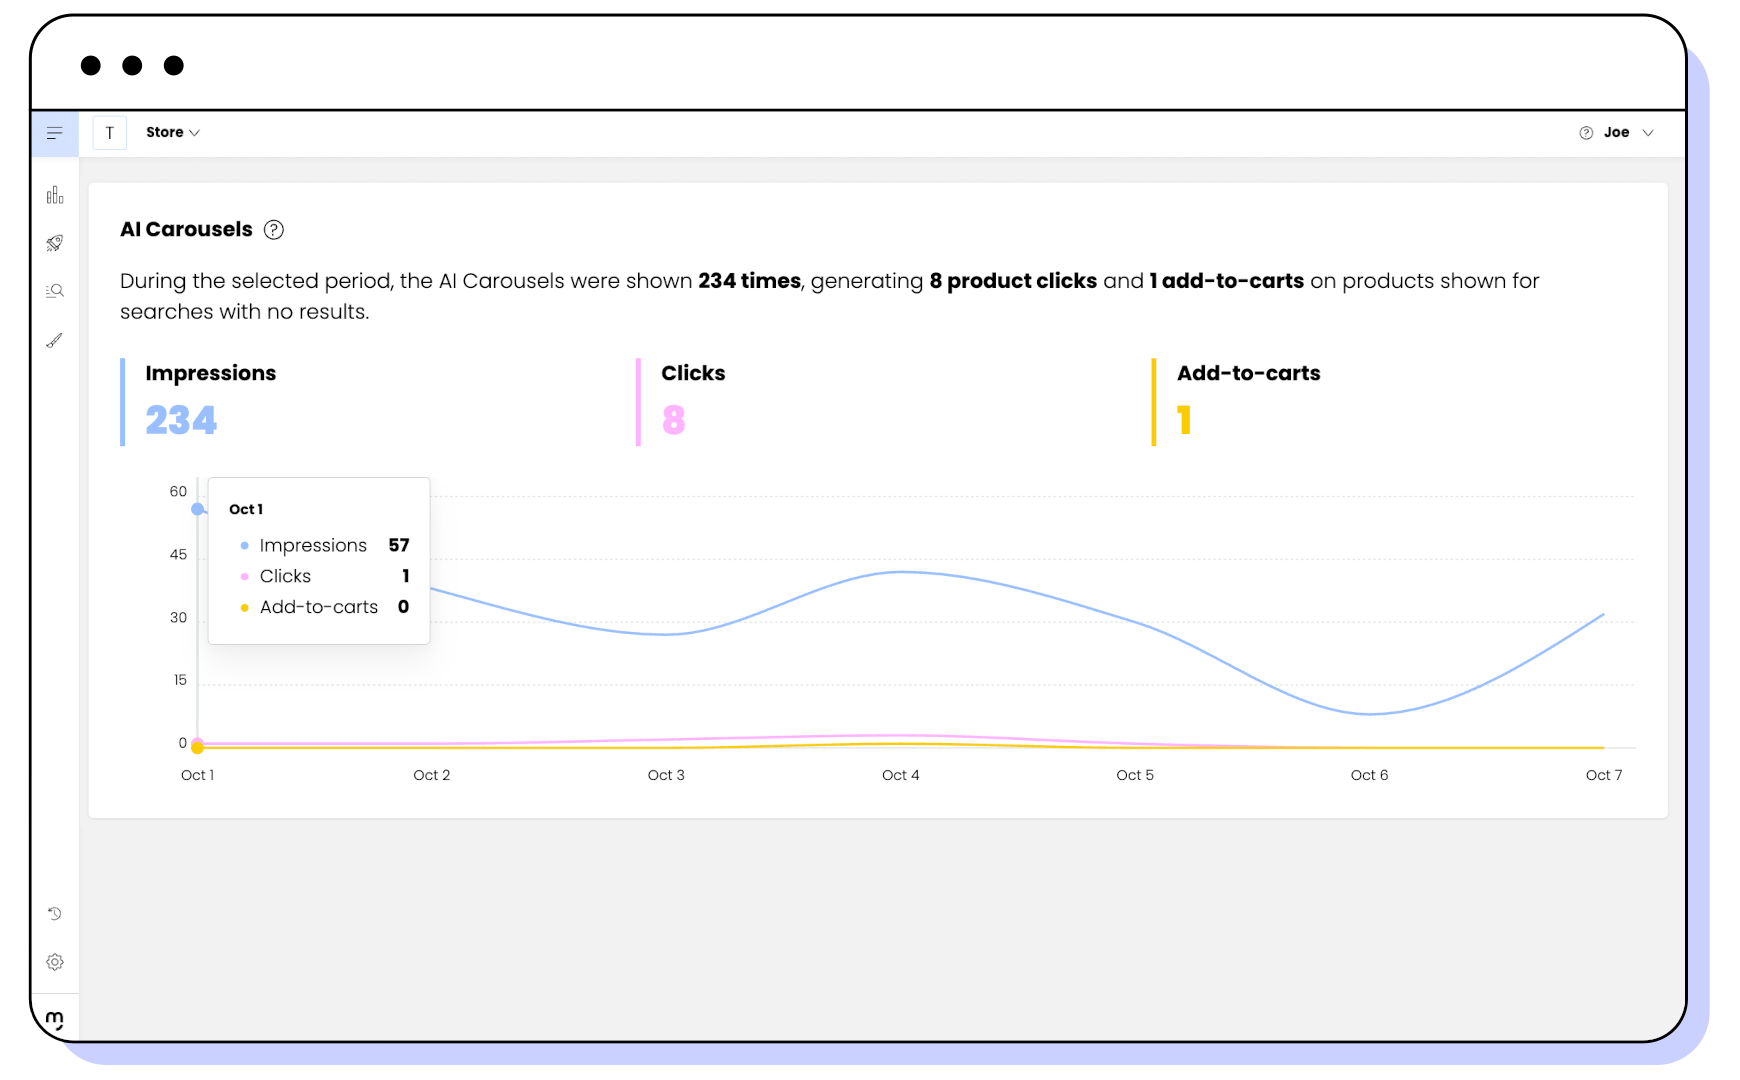
The AI Carousels section displays the following:
- Impressions: Number of times AI Carousels appear.
- Clicks: Number of clicks on products in AI Carousels.
- Add-to-carts: Number of add-to-cart clicks on products in AI Carousels.
The chart shows how these metrics evolve over the selected time frame.
Questions AI
The Questions AI section shows how shoppers interact with the products shown in Questions AI. Questions AI generates questions in real time to help shoppers discover products.
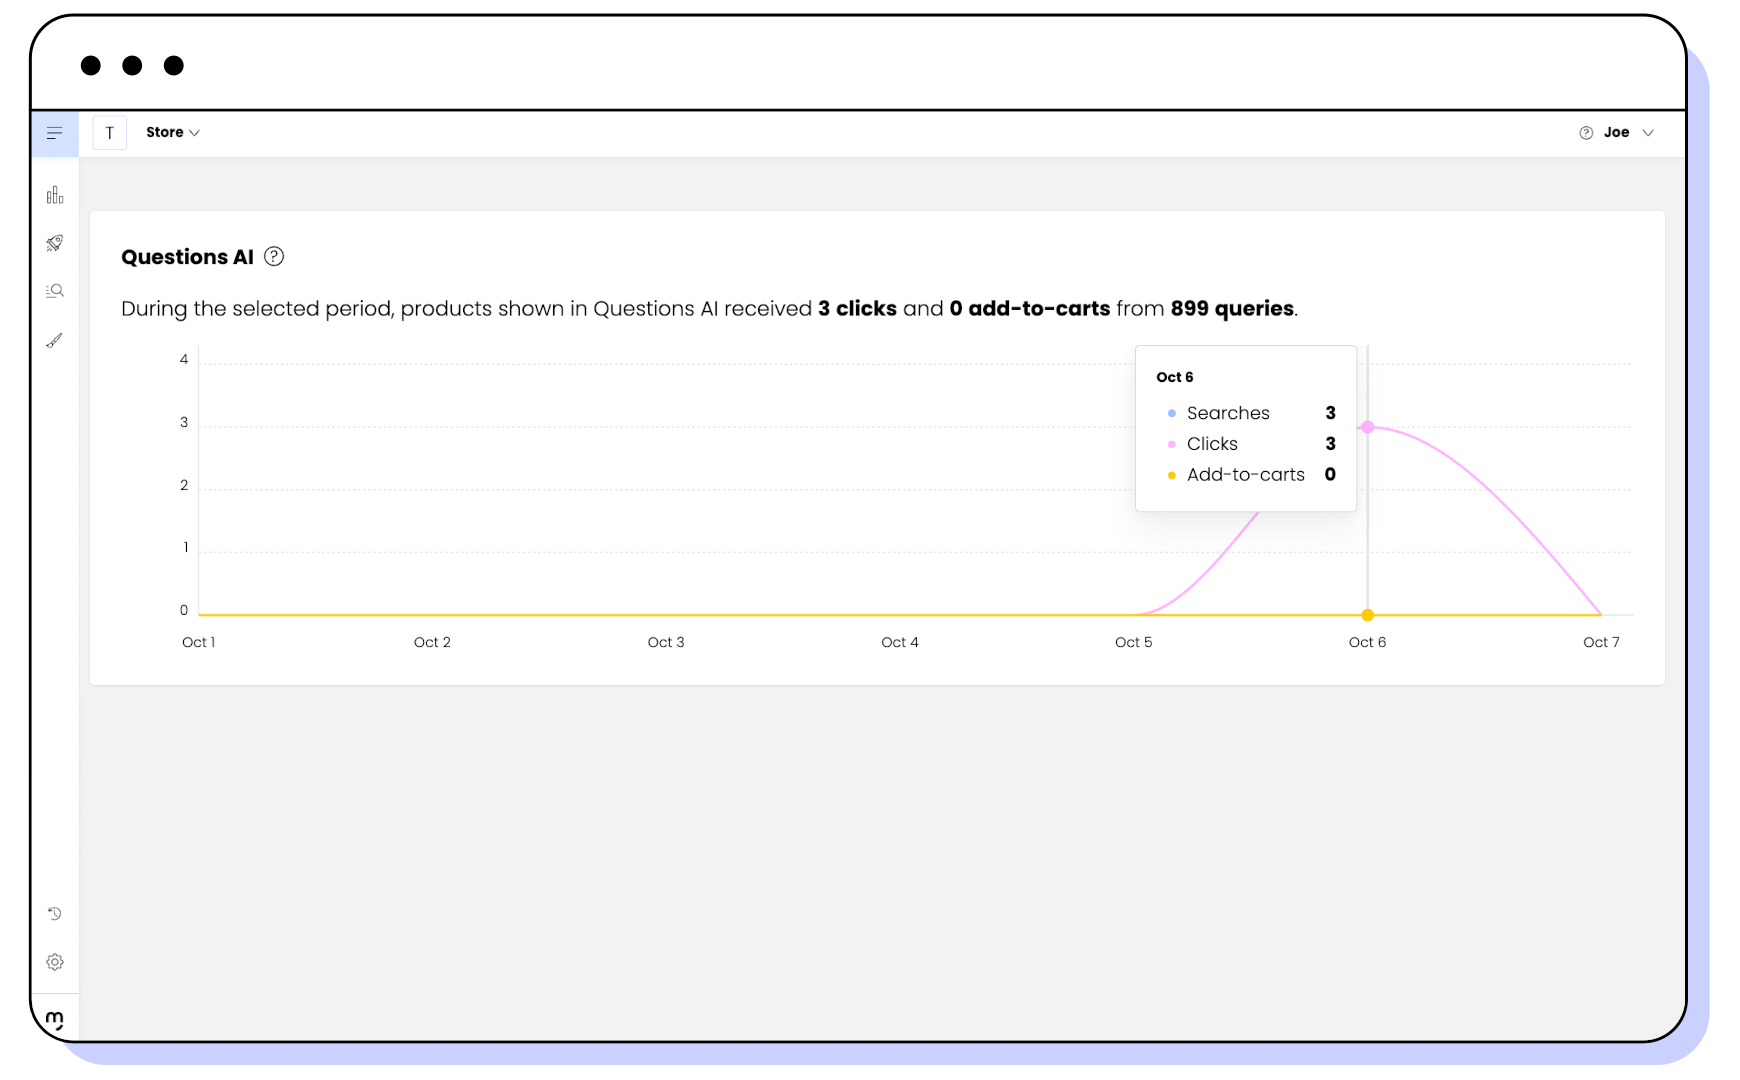
The summary at the top of the section shows the number of clicks and add-to-carts on products shown in Questions AI. For context, it also shows the total number of searches in your shop for the selected time frame.
For example, in the image, products shown in Questions AI receive 3 clicks and no add-to-carts. During the same time frame, shoppers make 899 searches in your shop.
The chart shows how these metrics evolve over the selected time frame. Hover over a date to see the following data for that date:
- Searches: Number of searches in which Questions AI appears.
- Clicks: Number of clicks on products shown in Questions AI.
- Add-to-carts: Number of add-to-cart clicks on products shown in Questions AI.